Skyrails, Rebuilt from Screenshots

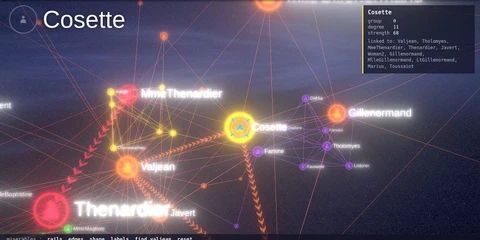 The characters of Les Misérables in the rebuilt Skyrails, with Cosette in focus
Around 2007, Yose Widjaja, then a student at the University of New South Wales, created Skyrails, a remarkable program for exploring networks in three dimensions. You travelled through the network itself, from node to node along glowing rails, as if you were inside the data. It looked like a video game at a time when most research tools were flat and grey. Behind the visuals was real depth: Skyrails had its own scripting language for styling and analysing graphs, and menus written in that language, so that people who could not program could still use it. All of this was the work of a single student. I saw a demo on YouTube years ago and never forgot it.
A program that vanished
Skyrails was never maintained. It ran on Windows, its home page at the university disappeared, and every link I followed was broken. What did survive were traces: an album of screenshots on Flickr, and a handful of blog posts from 2007, on FlowingData, on Tim Lambert’s Deltoid and on the InfoVis Wiki.
The screenshots are surprisingly informative. They show a night-blue sky streaked with cloud, edges drawn as animated chevrons, nodes shaped as icons or pie charts, and a radial menu that opens around a node when you hold down the right mouse button. They show the names of the scripts that drove each demonstration (labs.van, macaque.van, worldtrade.van), the menus those scripts created, and four themes called normal, desert, valley and openspace. One screenshot even preserves a single line of the scripting language, typed into the console at the top of the screen:
with all nodes do nodeplane x 1 -1 end
Rebuilding from the evidence
From this evidence, Claude rebuilt Skyrails overnight. The new version runs in a web browser with Three.js and should, in principle, work in a virtual reality headset. It copies the sky, the chevron rails, the glowing nodes with their icons, pie charts and rings, the large label of the node under the pointer, the radial menu and the four themes. It also has a small scripting language, built around the one line the screenshots preserve, so that with … do … end statements style the graph and define the menus.
To test it, I loaded three classic datasets: John Padgett’s network of Florentine families, with their marriage and business ties; Wayne Zachary’s karate club; and Donald Knuth’s network of characters in Les Misérables, where two characters are linked when they appear in the same chapter. The video below travels through the last of these, from Valjean to Javert, Fantine, Cosette and Marius. Each rail lights up as the camera follows it.
The result was so close to the screenshots that I immediately suspected that traces of the original code had been absorbed by the model during its training.
The original turns up
Then came a twist. After the rebuild, I found the original program on GitHub. A researcher had shared it in 2015, with Yose Widjaja’s permission, alongside the code for a talk on data visualisation at the ShmooCon security conference (RITHoneynet/DataVisualization, also copied in Light0617/3D_UIUX). It contains the Windows executables, the data, the shaders and the original scripts, but not the source code of the main engine.
So we could compare the two. The reconstruction came close to the look and feel of the original, but its scripting language and its shaders are very different. The original scripts read like this:
with all edges do (
   if(#marriage == 1) then (
      linkorigin <- marriage -> linktarget;
   ) end;
) end;
They define subroutines with sub, menus with menudef and menulink, colours with rgb: 130 0 0, and link types with arrows. None of this appears in the rebuild, which shares only the with … do … end form visible in the screenshot. The original shaders, with names such as BloomFX and RetinalBurnFX, have nothing in common with the new ones either.
This does not settle the question of memorisation. The original scripts have been public since 2015 and may well have been part of the model’s training data, and nobody, including the model, can say for certain what it has seen. But if the model had memorised Skyrails, I would expect it to have reproduced at least the language. The differences suggest that Claude worked from the evidence in the screenshots.
Digital archaeology and the sustainability of software
I think of this experiment as a form of digital archaeology: rebuilding a lost object from the traces it left behind, then finding the original and measuring how close we came. Like any reconstruction, the new Skyrails is an interpretation. Its appearance and its behaviour rest on the evidence, while everything underneath is new.
It is also a question of sustainability. Software becomes obsolete much faster than the data it was built to read. When a program dies, the files, scripts and visualisations made with it become hard to open, even when they survive. Much of the software of the 2000s now exists only as screenshots, videos and old binaries that fewer and fewer machines can run. The original Skyrails may still start on a Windows computer, or under an emulator, but it can no longer be maintained, adapted or ported, because its source code is lost.
As I predicted a few years ago, AI is becoming a practical tool against this kind of obsolescence. It can reconstruct a lost tool from its traces, and it can rebuild the readers that keep old data usable. The obvious next step for this project is to teach the new engine to read the original .van scripts and data files, so that the demonstrations Yose Widjaja wrote in 2007 can run again. For anyone who cares about data sustainability, in research, in archives or in the digital humanities, this deserves attention.
Skyrails was ahead of its time, and it still impresses nearly twenty years later. All credit for the idea and the design belongs to Yose Widjaja, and I hope this reaches him.
